Purchasing intelligence for furniture retailers

Know exactly what to reorder before stock becomes a problem.

InventoryLogic turns sales, stock, purchase orders, lead times, and supplier rules into clear reorder recommendations for retail businesses.

Built for furniture retailers and import-heavy businesses
SKUs monitored842
On order$842K
At risk38
Slow moving52

Risk summary

Order now18High risk$265K
Borderline20Watch$312K
Not needed804Healthy$1.2M

Top suppliers

Velora Home$912K
Coastwood$295K
Timberline$187K
The problem

Spreadsheets don't scale past a few hundred SKUs.

Retailers waste hours checking spreadsheets, guessing reorder quantities, and trying to balance stockouts against over-ordering — especially when stock is arriving in shipping containers, not next-day boxes.

×

Manual checks don't catch risk in time.

By the time someone notices a SKU is low, it's already too late to hit the next container.

×

Lead times get ignored under pressure.

120-day transit plus safety stock is hard to hold in your head across hundreds of lines.

×

Over-ordering ties up cashflow.

Without visibility into sell-through rate, slow stock quietly piles up in the warehouse.

The solution

Stop spending Monday mornings guessing what to order.

InventoryLogic reads your sales, stock, open purchase orders, and supplier lead times, then builds the purchasing plan itself — in minutes, not a whole afternoon of spreadsheet checking.

Product workflow

Everything your purchasing team needs, without exposing private business data.

The examples below use redesigned demo data and recreated interface components, not private store screenshots.

SKUDescriptionRiskQtyCover days
IL-128Oak chairOrder now3628 days

Reorder planner

Clear reorder quantities by SKU, supplier, MOQ, pack size and target cover days.

40ft container91% full
DiningLoungesSideboards

Container planning

Build purchase orders against real CBM capacity and fill-ratio targets.

ScenarioArrivesUnitsCBMValue
BaseNov27497$75K
Delay +7dNov281101$78K

Scenario compare

Test lead-time delays, safety stock changes and extra cover before committing.

Customer Intelligence

Understand who buys, who returns and where action is needed.

Built from the customer analysis already available in the platform: customer overview, repeat behaviour, segmentation, retention, customer exploration and prioritised actions.

Analysis complete5,420 customers01 Jul 2025 – 30 Jun 2026 · All outlets
Actions found1,486Prioritised from observed purchase history
Customer Overview · Demo data
Customers5.4k
Repeat rate22.8%
Net customer revenue$9.6M
Average order value$914
Revenue per customer$1.7k
Repeat-customer revenue39.4%
Revenue from new versus returning customersMonthly
JulSepNovJanMarMay
New customer revenueReturning customer revenue
Customer segments by lifetime revenueRevenue
$2.2M
$2.0M
$1.5M
$1.2M
$950K
$810K

Customer overview & segments

Review the same customer KPIs and segment structure shown in the program, using anonymised demonstration data.

Time Between Purchases
Time between customer purchasesDays
Median: 50 days 0 100 200 300 400 0 60 120 180 240 300+ Days between purchases Count

Time between purchases

Show how long customers typically wait before purchasing again, using the same analysis already present in the program.

Retention
Customer retention by cohort% returning
0
1
2
3
4
Jan
10037261710
Feb
1003424159
Mar
10039271811
Apr
1003222148

Customer retention

Track how customer cohorts return over time without exposing production records.

Customer Explorer & Action Centre
customer_idsegmentorderslifetime_spendlast_orderdays_sincepostcodesuggested_action
C-1048Champion6$7,28018 Jun124000Recommend new range
C-2157At Risk VIP4$5,94011 Mar1114217Personal follow-up
C-3062Loyal8$9,31009 Jun214556Preview new arrivals
C-4179New Customer1$1,18002 Jul34064Review customer history

Customer Explorer & Action Centre

Customer filters, history fields and prioritised actions are combined into one clearer marketing view.

DELIVERY INTELLIGENCE

Understand where demand is concentrated and where the next store could succeed.

Explore delivery hotspots, postcode demand and recommended store catchments using anonymised demonstration data from the Delivery Intelligence module.

Delivery Intelligence

Understand where demand is coming from and identify the best locations for new stores.

Delivery demand map

Find where customers are ordering, how concentrated demand is, and which areas are accelerating.

Demand analysis
Delivery orders13,982Selected period
Units delivered41,7463.0 units per order
Mapped postcode areas694Top 5 hold 6.8%
Leading hotspotNoosa Heads
4567
241 orders · momentum +16.4%
Demand mapHeat and bubble markers show delivery concentration.
Noosa Heads4567 Newcastle Wollongong Geelong Fremantle Hobart Cairns
Top demand areas
#1 Noosa Heads 4567241
#2 Newcastle 2300204
#3 Geelong 3220186
#4 Wollongong 2500173
#5 Fremantle 6160151
#6 Hobart 7000137
#1 Noosa Heads 4567QLD

Delivery orders: 241
Units delivered: 1,428
Share of mapped demand: 1.7%
Order momentum: +16.4%
Recent API sales: $14,860

+
Delivery ordersTop 5 areasRanks 6–20Other areas

Recommended new store catchments

Rank broader demand pockets using order volume, delivered units, density, momentum and distance from existing stores.

Strategic planning
Top opportunityMaroochydore
4558
Sunshine Coast / QLD
Orders in catchment3,21422.9% of selected-market orders
Recommendation score83.6Confidence 95.0
Store gap6.1 kmMomentum +5.7%
Opportunity mapStars indicate recommended suburb and postcode anchors.
Maroochydore Toowoomba Wollongong Ballarat Launceston Coffs Harbour
Highest-ranked catchments
#1 Maroochydore 45583,214
#2 Toowoomba 43502,476
#3 Wollongong 25002,118
#4 Ballarat 33501,406
#5 Coffs Harbour 2450864
#6 Launceston 7250603
#1 Maroochydore 4558Sunshine Coast / QLD

Orders in catchment: 3,214
Units delivered: 9,682
Market order share: 22.9%
Momentum: +5.7%
Postcodes covered: 71
Nearest existing store: 6.1 km
Recommendation score: 83.6
Confidence score: 95.0

+
Recommendation score80+ High60–79 Good40–59 Medium<40 Low
Sales & Performance Intelligence

Turn sales history into ranked commercial actions.

Review the most important views from the Sales Analysis Centre: performance, monthly momentum, ranked actions, product changes and store range gaps.

Measure performance by
EXECUTIVE SUMMARY

Revenue analysis · 2025-07-01 to 2026-06-30

20,519 matching sales lines were analysed using a 90-day recent versus prior comparison.

254 accelerating301 declining0 seasonal1,095 store gaps141 growing areas165 cross-sell pairs
OverviewAction requiredProductsStores and areasCross-sellReports and data
Net sales$10.76mSelected filters and date range
Gross profit$6.20mNet sales less recorded line cost
Gross margin57.6%Based on available cost data
Orders12,659Unique transactions
Units sold55.3kPositive quantity sold
Products1,529Distinct products analysed
Opportunities30Ranked signals shown
High priority30Priority score of 75+

Monthly revenue trend

Monthly values for the selected measure. Hover-style detail is shown for November 2025.

Nov 2025 Revenue: $1.42m +41.8% vs prior period Jul 2025Sep 2025Nov 2025Jan 2026Mar 2026May 2026

Product momentum map

Each point represents one anonymised product. The horizontal axis compares recent performance with the prior period; the vertical axis shows the selected measure.

Growth versus comparison (%) Recent revenue ($) -1000100200300+
Action required

Ranked sales opportunities

One highest-priority action is shown for the selected analysis measure.

1
STORE RANGE / AVAILABILITY GAP Priority 97.8

Arden Extendable Dining Table — Smoked Oak

SKU IL-207418 · Richmond

Current$22.1k
Comparison$41.3k expected
Change-46.4%
Confidence98%
Why it was flagged and recommended action

Why: Based on Richmond's 14.2% share of company activity, this product would be expected to produce about $41,280 in revenue, versus $22,140 actual.

Recommended action: Check whether the product is ranged, displayed and available at Richmond; confirm local suitability before replenishing or transferring stock.

Stores and areas

Largest store range and availability gaps

Rank the most commercially meaningful store-product gaps instead of showing every signal.

Richmond — Arden Extendable Dining Table$19.0k
Fortitude Valley — Kora Dining Chair$13.7k
Southport — Nysa Bookcase$11.0k
Burleigh Heads — Orin Credenza$10.5k
Paddington — Luma Chest of Drawers$8.7k
Cross-sell Opportunities
Dining Table
+
Dining Chair
42%
Modular Sofa
+
Side Table
31%
Bed Frame
+
Bedside
27%

Cross-sell opportunities

Highlight product combinations already identified by the existing sales analysis.

Case study

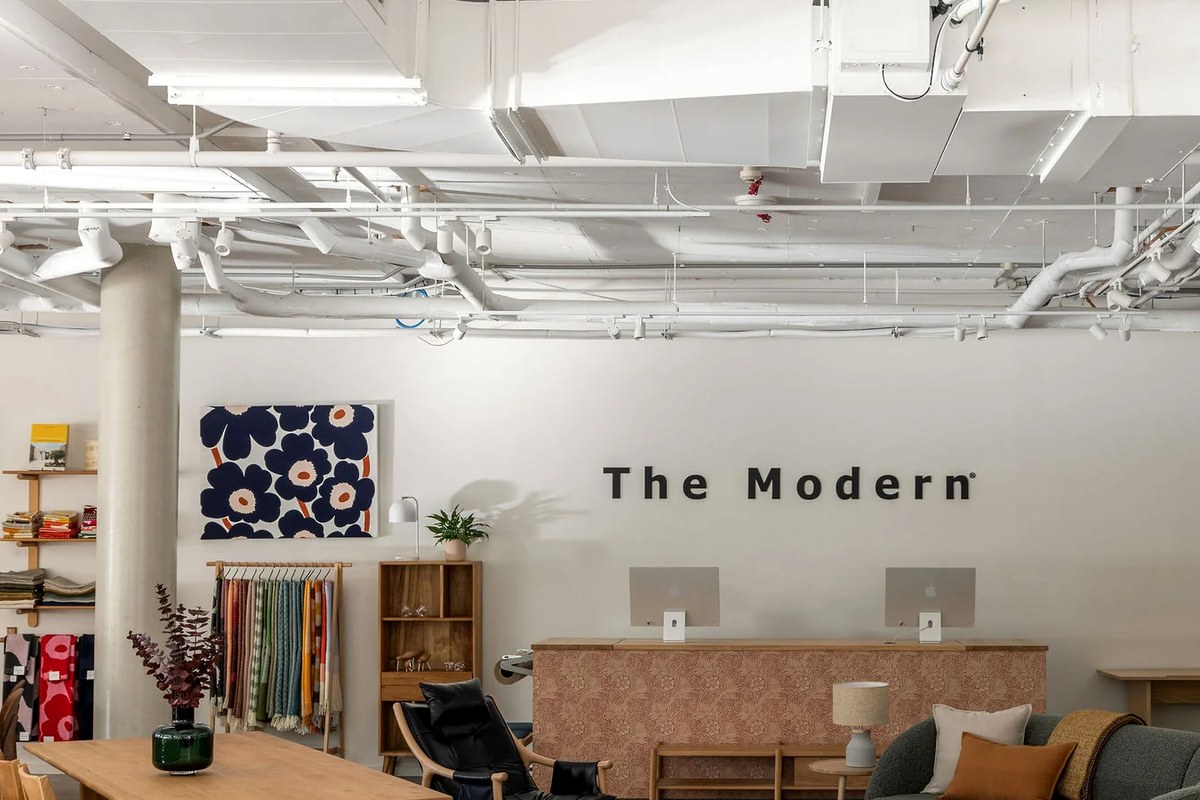
The Modern Furniture Store

How a furniture retailer removed guesswork, cut stockouts, and improved cash flow with InventoryLogic.
Moved from manual spreadsheets to a repeatable reorder workflow.
Created clearer visibility across suppliers, containers, stock and open POs.
Focused marketing efforts on the products most preferred by each customer segment.
The Modern showroom
↓ 35%
Stockout risk reduction
↑ 28%
Increase in stock turns
20+ hrs
Saved weekly on manual work
↑ 18%
Improvement in cashflow visibility
★★★★★

“Clearer decisions. Lower inventory value. Easy to use.”

“InventoryLogic helped us reduce our inventory value by giving our team clearer visibility into what needs to be ordered, what can wait, and where excess stock is building up. The system is easy to use and turns complex inventory data into clear, actionable purchasing decisions.”

— Kathy, CEO at The Modern

Who is this for

Built only for furniture retailers and importers.

InventoryLogic is focused on furniture businesses with bulky SKUs, long lead times, supplier MOQs and container-based purchasing.

🛋️

Furniture retailers

For stores managing hundreds of chairs, tables, sofas and cabinet lines.

🚢

Furniture importers

For businesses ordering by container from multiple overseas suppliers.

🏬

Multi-brand showrooms

For teams that need one purchasing plan across styles, finishes and ranges.

📦

Furniture warehouses

For operations teams balancing stock cover, arrivals and available capacity.

Why InventoryLogic

We only build for furniture.

InventoryLogic is tuned to how furniture actually moves: bulky SKUs, long factory lead times, variants by finish, and stock that arrives by container rather than by box.

Bulky, high-value SKUs

  • Reduce the risk of over-ordering expensive lines.
  • See where stock is tying up cash.
  • Prioritise the products that need action first.

Finish & upholstery variants

  • Track cover days for each finish and fabric.
  • Separate strong variants from slow-moving ones.
  • Avoid treating every style as one product.

Container-based replenishment

  • Plan orders around supplier lead times.
  • Compare unit, value and container requirements.
  • Build purchasing plans before stock becomes urgent.

Three extended intelligence modules

  • Customer Intelligence: value, retention and actions.
  • Delivery Intelligence: demand maps and store opportunities.
  • Sales Intelligence: revenue, units, orders and ranked actions.
PERSONALISED SERVICE

Real support from setup to everyday purchasing decisions.

InventoryLogic is tailored to your suppliers, lead times and team workflow. Support is available to explain recommendations, answer questions and help your team get the most from the system.

Harry Josephson
Harry JosephsonFounder & CEOFormer Furniture Warehouse & Inventory ProfessionalBSc Physics (QUT)Statistical Modelling & AIAustralia
Built in Australia

Built by someone who has lived the problem.

InventoryLogic was built by Harry Josephson, who spent more than seven years working in warehouse operations, inventory control, and purchasing within the Australian furniture retail industry.

Throughout his career, Harry worked alongside warehouse managers, purchasing teams, CEOs, and senior management, gaining first-hand experience with the challenges of managing large product catalogues, long supplier lead times, and container-based purchasing. He saw how critical inventory decisions were still being made using spreadsheets, manual calculations, and experience rather than intelligent planning tools.

Today, Harry is completing a Bachelor of Science (Physics) at the Queensland University of Technology (QUT), specialising in Advanced Statistical Mathematics. applying statistical modelling, optimisation techniques, and artificial intelligence to solve real-world inventory planning problems.

InventoryLogic combines Harry's practical experience in furniture retail with advanced analytical methods to help businesses reduce stockouts, improve cash flow, optimise purchasing decisions, and gain complete confidence in their inventory planning.

InventoryLogic exists because the spreadsheets Harry relied on every day simply couldn't keep up with the complexity of modern inventory management. So he built the platform he wished he had.

Pricing

Pricing built around your operation.

Every furniture business has a different catalogue, supplier network and purchasing cycle. We scope InventoryLogic around your actual requirements.

Contact

Ready to take the guesswork out of reordering?

Book a 20-minute demo and see how InventoryLogic would work with your catalog, suppliers and purchasing cycle.

harry@inventorylogic.com.au
Australia

By submitting this form, you agree that InventoryLogic may use your details to respond to your enquiry and arrange a demonstration. See our Privacy Policy.